Prometheus Remote Write Performance Issue
Prometheus 開啟 Remote Write 後會造成整體 Memory 上升
這篇文章將作為 Prometheus 開啟 Remote Write 後會產生的 Memory 大幅上升的 Issue 調查紀錄。
事件發生
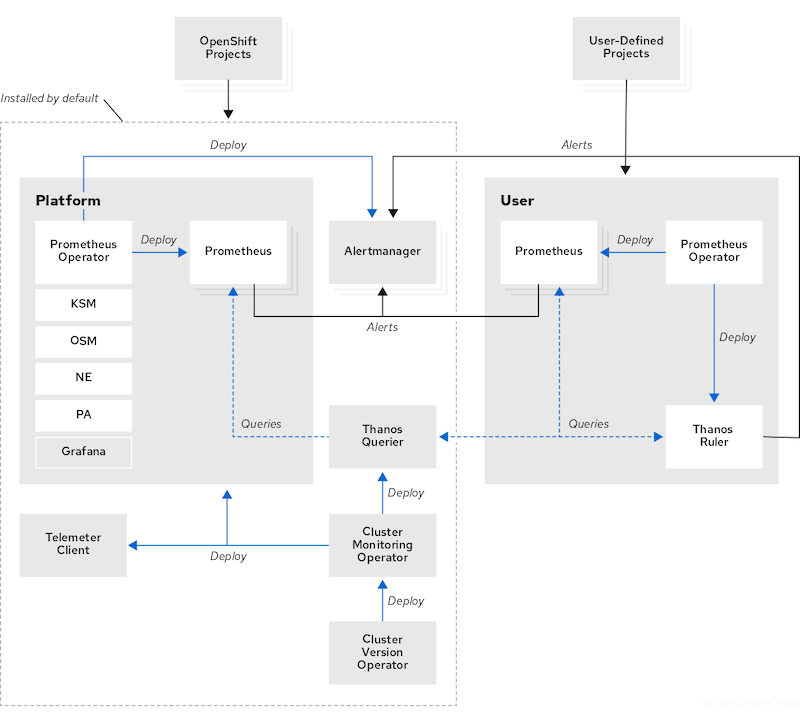
客戶的 Openshift 需要 metrics data 支援 long-term storage,請我們協助。而根據官方的設定文件,Openshift 的 Monitoring 架構上,可以看到 default 部署的 resource 中,有安裝 Thanos 服務:
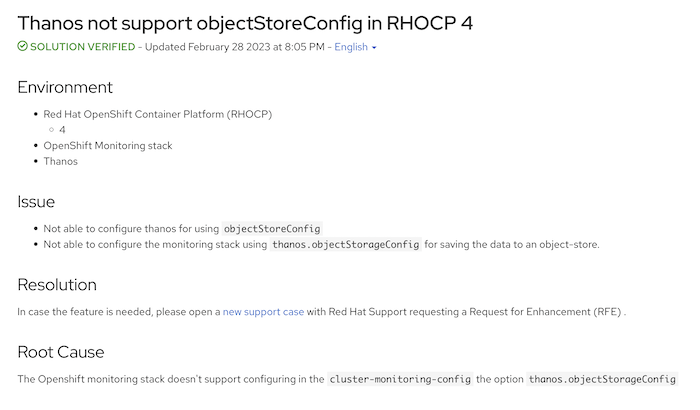
一開始,我希望透過設定 Thanos Sidecar 的 configuration,將資料上傳到 S3 buckets,因為 Openshift monitoring stack 與 Prometheus Operator 上有相似的的設定,而 Prometheus Operator 可以透過調整 configmap 來改變 thanos 的設定,但調查後發現,直到撰寫本文的今天,Openshift 尚未開放 Thanos 的設定:
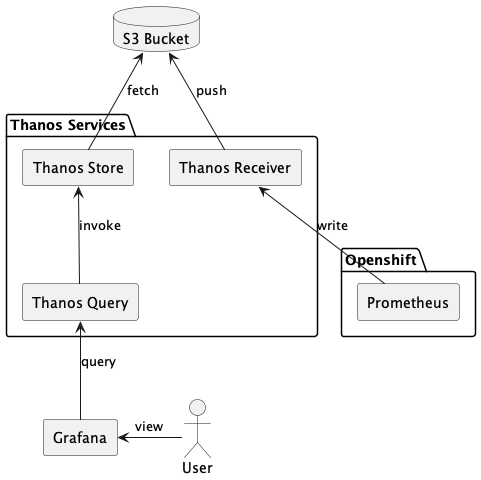
在與客戶討論後,決定採用 Prometheus 的 remote write 功能,在外部架設 Thanos 服務,使 metrics 送往 Thanos Receiver,再上傳至 S3 Bucket:
remote write 功能可以透過修改 cluster-monitoring-operator 來開啟:
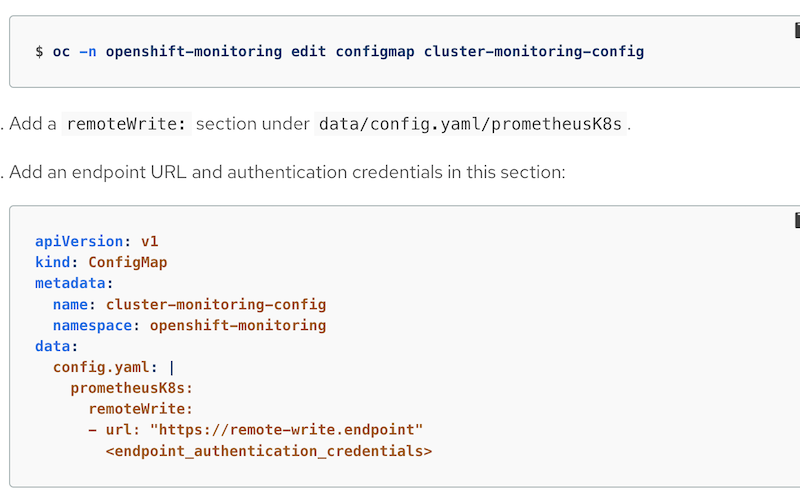
沒想到,完成 remote write 的設定後,每一座 Prometheus 的 memory usage 馬上升高 30% 左右,觸發 node 設定的 resource threshold 的告警,顯示記憶體不足,緊急移除設定。
因此,客戶希望我們調查,remote write 功能開啟後,會使 node 的 memory usage 升高多少,在完成調查以前,功能無法上線。
調查經過
在 Prometheus 的官方文件上有提到,根據多數用戶回報, 開啟 remote write 會導致 memory 增加 25%,但這取決於資料量,而我不知道該如何預估這個資料量。
Memory usage
Using remote write increases the memory footprint of Prometheus. Most users report ~25% increased memory usage, but that number is dependent on the shape of the data.
起初,我希望透過 Prometheus 所提供的各種 metrics 進行估算,例如: target 數, samples 數等等,但始終無法提供一個明確的答案,因為 Prometheus 可以針對不同 job 調整 scrape 的時間,客戶的每個 cluster 設定、網路狀況都不一樣,實在難以計算。
一籌莫展之際,無意間發現在 promtool 中,有一個指令,或許可以解決我的問題 debug pprof:
query labels [<flags>] <server> <name>
    Run labels query.

debug pprof <server>
    Fetch profiling debug information.

debug metrics <server>
    Fetch metrics debug information.

debug all <server>
    Fetch all debug information.
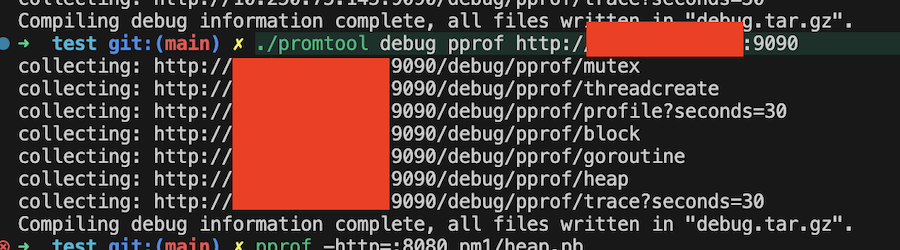
pprof 是 google 提供的一個分析 profiling data 的工具,而 Prometheus 內建有提供 pprof API,可以透過以下指令抓取 Prometheus 的 profiling data:
./promtool debug pprof <prometheus-ip>
我使用 promtool 抓取 remote write 開啟前後的 profiling data,併進一步分析他們的效能:
效能分析
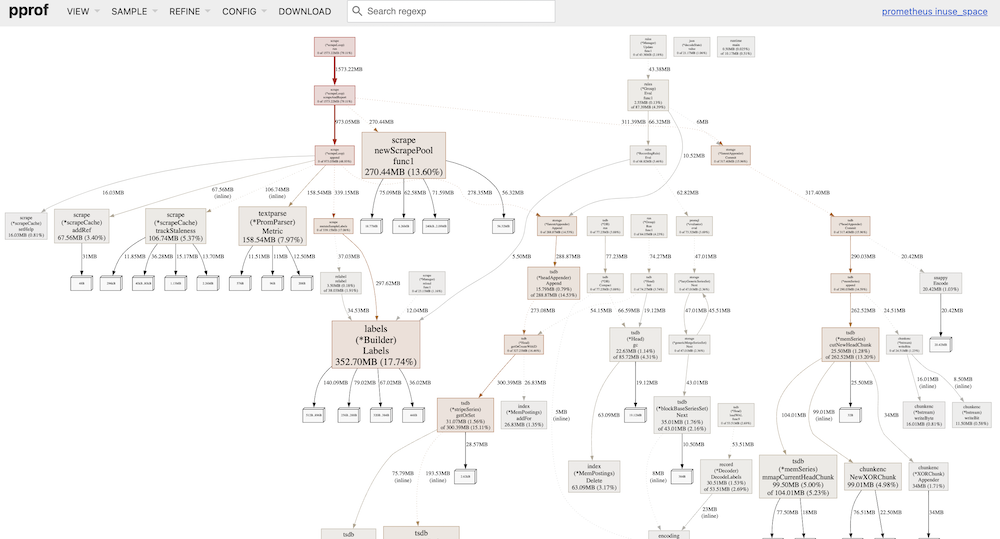
透過 pprof 工具可以將 profiling data 透過 web 的方式呈現:
pprof pprof -http=:8080 <pb-file-path>
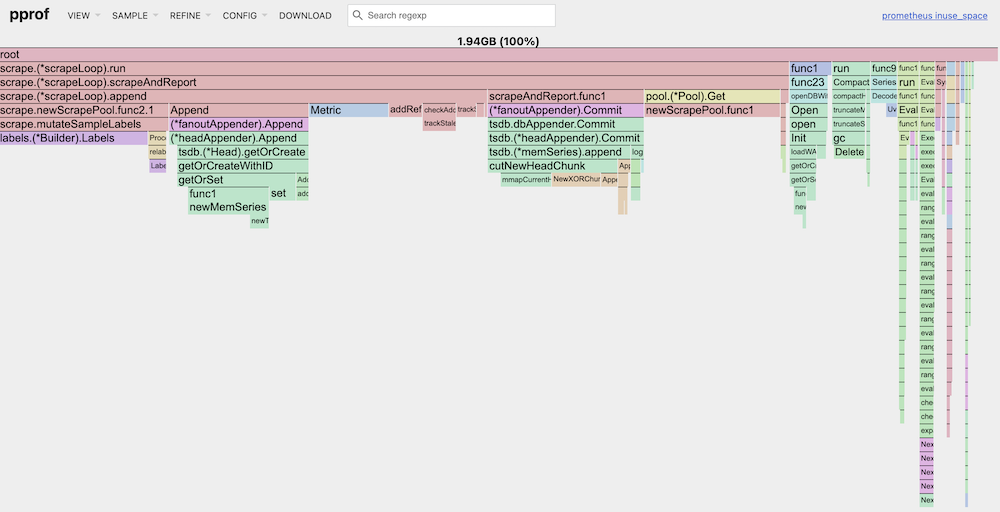
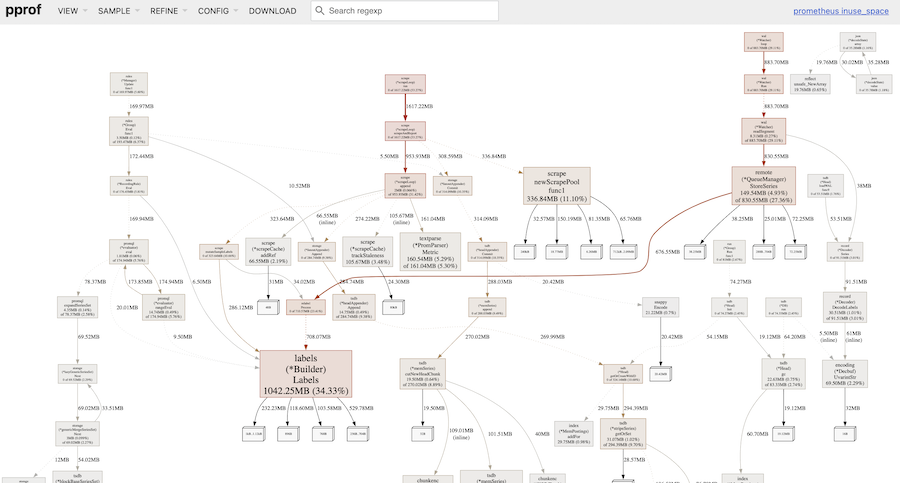
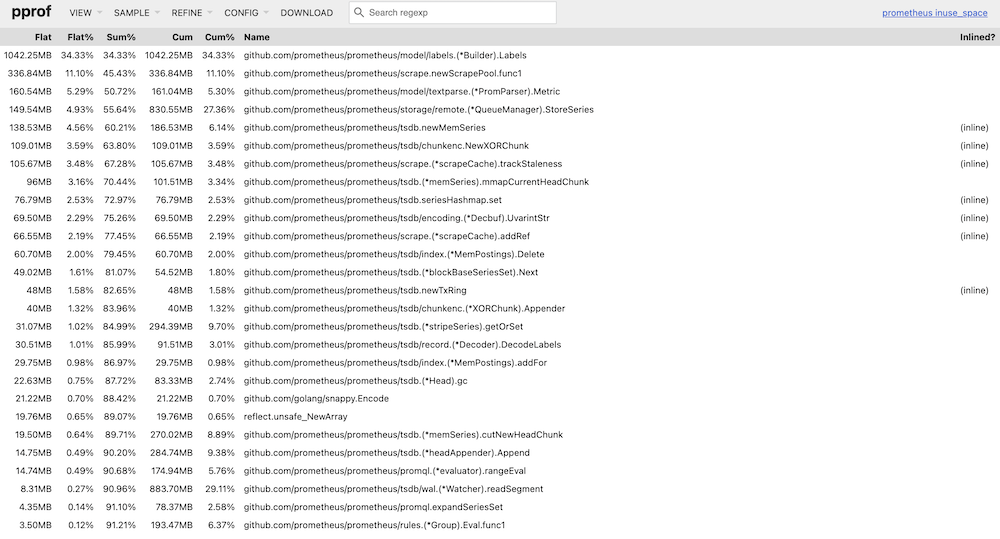
以下是開啟/關閉 remote write 功能後的 profiling data,並透過 web 方式呈現,從 Flame Graph 上可以看到,開啟 remote write 後,相較於關閉,會多出 1G 左右的 memory usage:
關閉 Remote Write 的 Prometheus
Graph
Top
Flame Graph
開啟 Remote Write 的 Prometheus
Graph
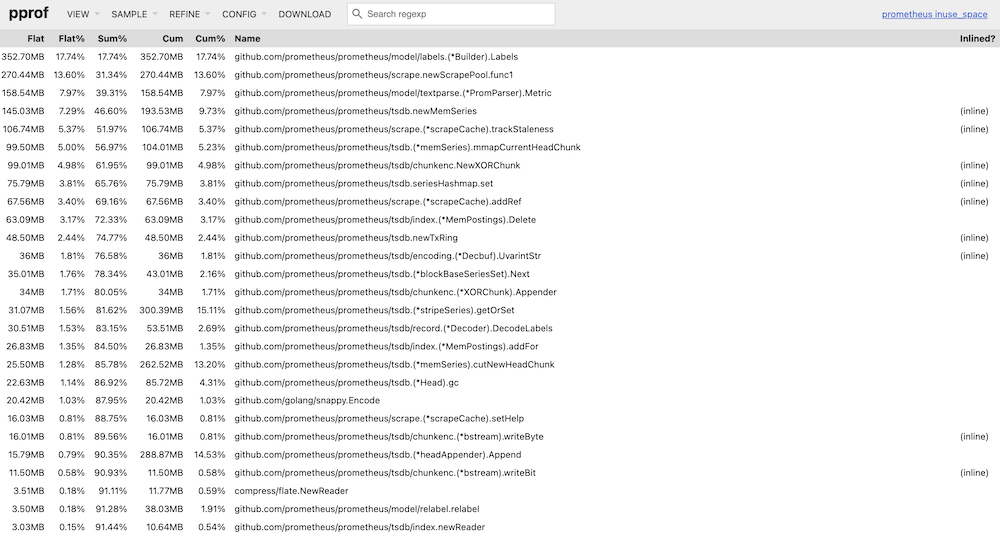
Top
Flame Graph
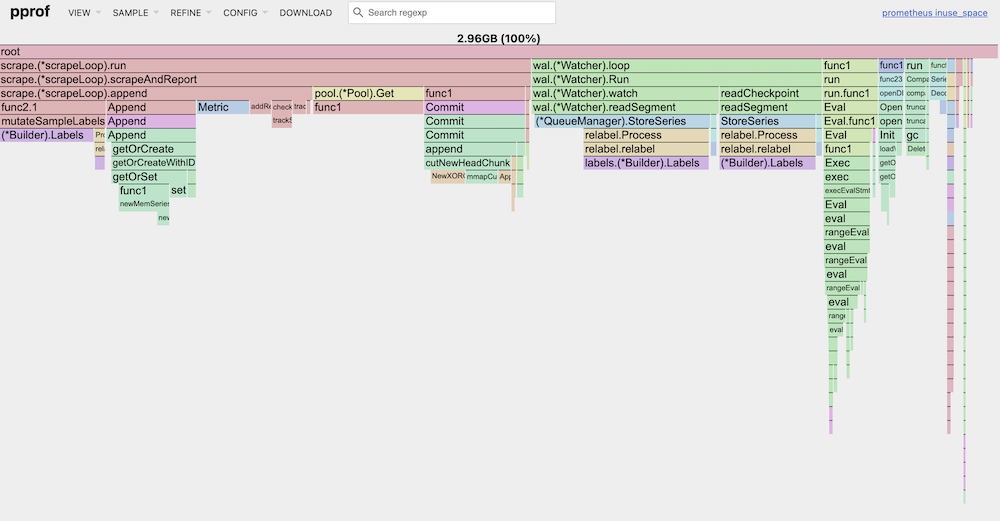
分析 Top 及 Graph 的結果可以發現,開啟 remote write 後,Prometheus 會執行 struct Watcher 的 function loop,並且在 node 上 alloc 了 29% 的 memory:
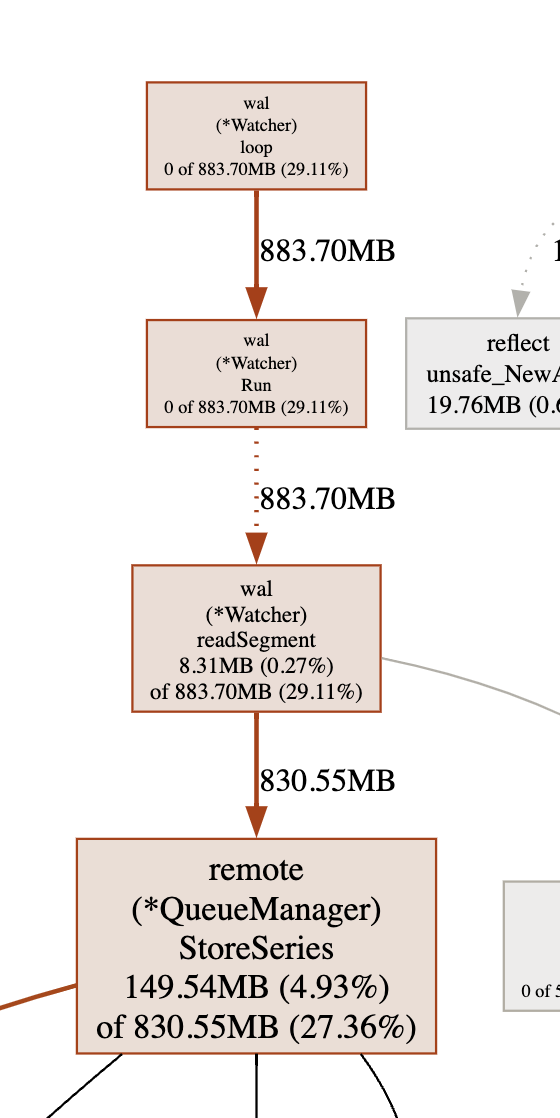
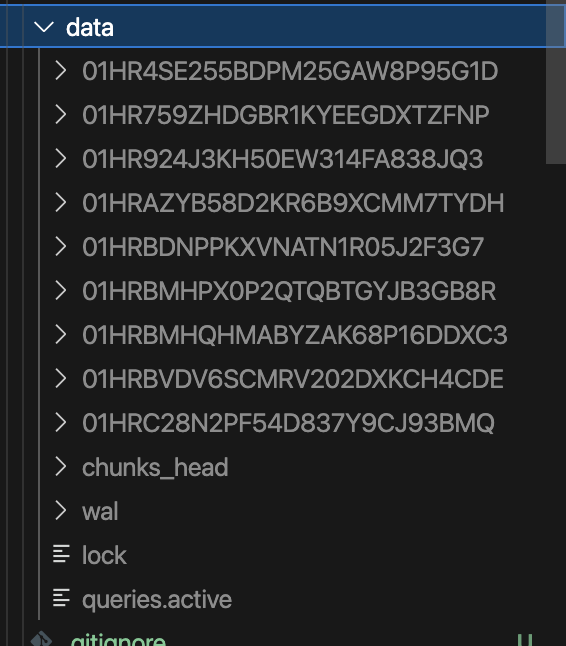
透過分析 Prometheus 的 Source 以後,我發現,Watcher 會讀取 Prometheus 的 wal 目錄下的資料,暫存於 memory 中:
https://github.com/prometheus/prometheus/blob/main/tsdb/wlog/watcher.go#L245
func (w *Watcher) loop() {
	defer close(w.done)

	// We may encounter failures processing the WAL; we should wait and retry.
	for !isClosed(w.quit) {
		w.SetStartTime(time.Now())
		if err := w.Run(); err != nil {
			level.Error(w.logger).Log("msg", "error tailing WAL", "err", err)
		}

		select {
		case <-w.quit:
			return
		case <-time.After(5 * time.Second):
		}
	}
}
結論
閱讀 Prometheus 的官方文件後得知,wal 目錄是存放 metrics data 的暫存檔,因此,如果要計算 remote write 開啟後對於 Prometheus 的影響,可以透過 cd 進入 wal 目錄,執行 du -sh 調查暫存檔的大小,就能粗略估計 memory usage 的成長量: