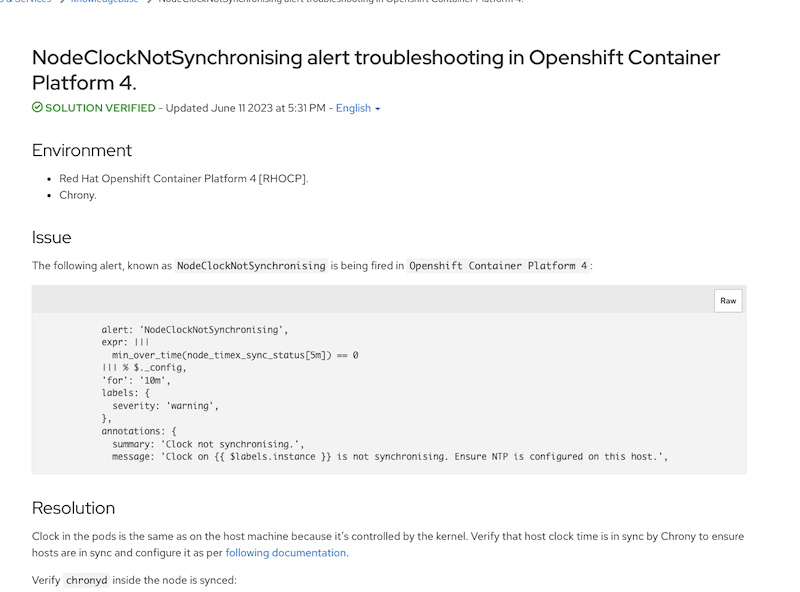
NodeClockNotSynchronising alert troubleshooting in Openshift 4
NTP Server 不同步事件調查
這篇文章將探討 NTP (Network Time Protocol) 服務器在 Openshift 發生的同步問題的原因和解決方法。文章將提供故障診斷的內容。
事件發生
某日客戶收到來自 OCP 的 critical 告警,名稱為 NodeClockNotSynchronising,請我們調查原因。
告警訊息
首先調查告警意義,至 openshoft-monitoring Project 下尋找名為 prometheus-k8s-rulefiles-0 的 ConfigMap,便可看到以下內容
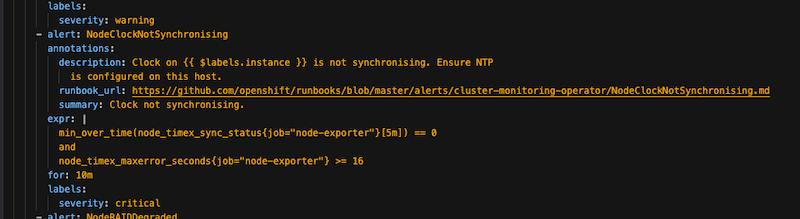
- alert: NodeClockNotSynchronising
annotations:
    description: Clock on {{ $labels.instance }} is not synchronising. Ensure NTP
    is configured on this host.
    runbook_url: https://github.com/openshift/runbooks/blob/master/alerts/cluster-monitoring-operator/NodeClockNotSynchronising.md
    summary: Clock not synchronising.
expr: |
    min_over_time(node_timex_sync_status{job="node-exporter"}[5m]) == 0
    and
    node_timex_maxerror_seconds{job="node-exporter"} >= 16
for: 10m
labels:
    severity: critical
根據官方文件,我們可以得知以下訊息:
The NodeClockNotSynchronising alert triggers when a node is affected by issues with the NTP server for that node. For example, this alert might trigger when certificates are rotated for the API Server on a node, and the certificates fail validation because of an invalid time.
而判斷的條件主要是兩項指標,他們分別的意義如下:
node_timex_sync_status
node_timex_sync_status returns 1 if NTP is working properly,or 0 if NTP is not working properly. node_timex_maxerror_seconds indicates how many seconds NTP is falling behind.
node_timex_maxerror_seconds
The alert triggers when the value for min_over_time(node_timex_sync_status[5m]) equals 0 and the value for node_timex_maxerror_seconds is greater than or equal to 16.
客戶環境
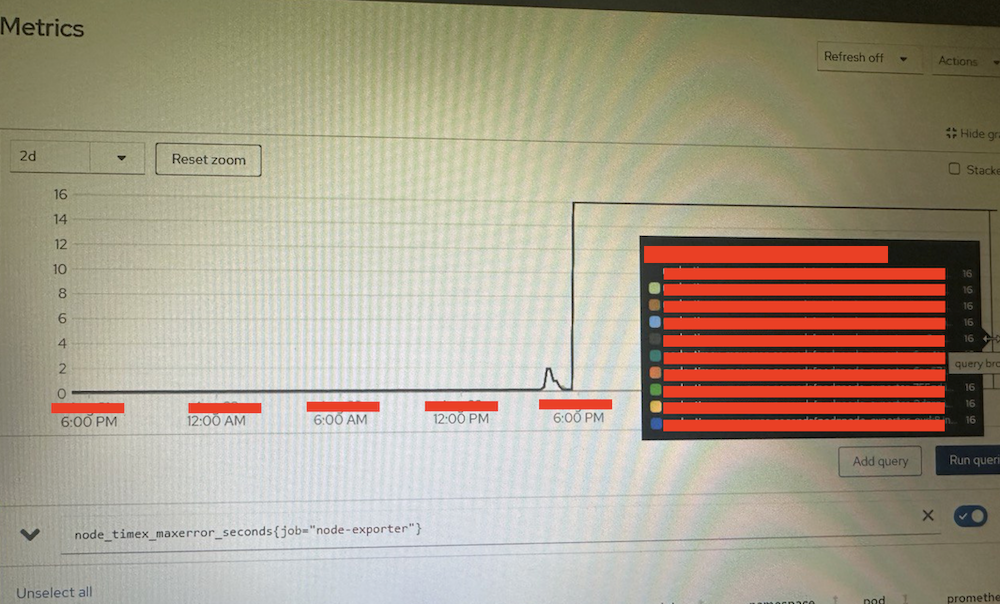
接下來可至 Observe/Metrics 頁面查看客戶當前的指標,可以發現以下情況:
node_timex_sync_status 為 0
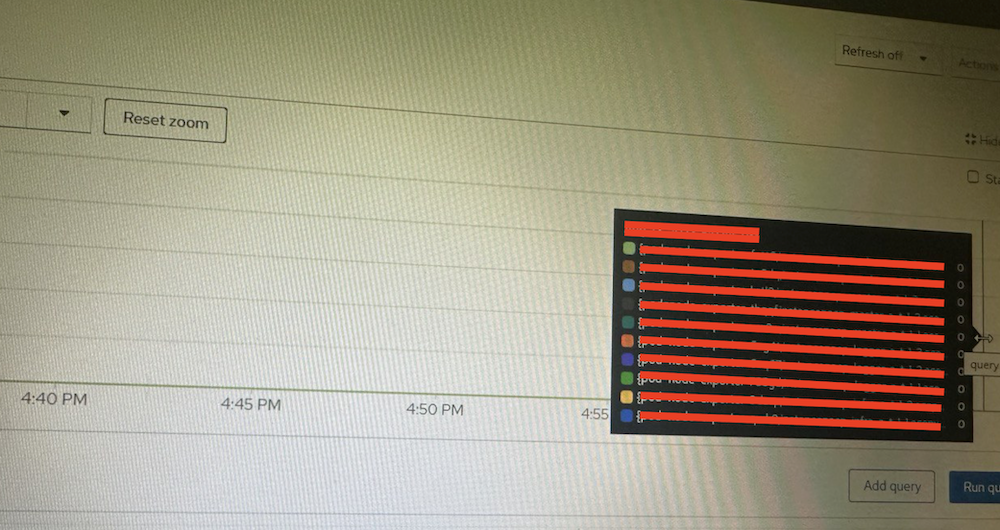
node_timex_maxerror_seconds{job="node-exporter"} 為 16
調查 Metrics 原理
上述發生在所有node中,由此判斷可能是 NTP 的問題,為了進一步瞭解 metrics 的實際意義,便查看 node_exporter 的源碼:
https://github.com/prometheus/node_exporter/blob/master/collector/timex.go#L176
const (
	// The system clock is not synchronized to a reliable
	// server (TIME_ERROR).
	timeError = 5
	// The timex.Status time resolution bit (STA_NANO),
	// 0 = microsecond, 1 = nanoseconds.
	staNano = 0x2000

	// 1 second in
	nanoSeconds  = 1000000000
	microSeconds = 1000000
)

...

func (c *timexCollector) Update(ch chan<- prometheus.Metric) error {
	var syncStatus float64
	var divisor float64
	var timex = new(unix.Timex)

	status, err := unix.Adjtimex(timex)
	if err != nil {
		if errors.Is(err, os.ErrPermission) {
			level.Debug(c.logger).Log("msg", "Not collecting timex metrics", "err", err)
			return ErrNoData
		}
		return fmt.Errorf("failed to retrieve adjtimex stats: %w", err)
	}

	if status == timeError {
		syncStatus = 0
	} else {
		syncStatus = 1
	}
	if (timex.Status & staNano) != 0 {
		divisor = nanoSeconds
	} else {
		divisor = microSeconds
	}
	// See NOTES in adjtimex(2).
	const ppm16frac = 1000000.0 * 65536.0

	ch <- c.syncStatus.mustNewConstMetric(syncStatus)                               // node_timex_sync_status
	ch <- c.offset.mustNewConstMetric(float64(timex.Offset) / divisor)
	ch <- c.freq.mustNewConstMetric(1 + float64(timex.Freq)/ppm16frac)
	ch <- c.maxerror.mustNewConstMetric(float64(timex.Maxerror) / microSeconds)     // node_timex_maxerror_seconds
	ch <- c.esterror.mustNewConstMetric(float64(timex.Esterror) / microSeconds)
	ch <- c.status.mustNewConstMetric(float64(timex.Status))
	ch <- c.constant.mustNewConstMetric(float64(timex.Constant))
	ch <- c.tick.mustNewConstMetric(float64(timex.Tick) / microSeconds)
	ch <- c.ppsfreq.mustNewConstMetric(float64(timex.Ppsfreq) / ppm16frac)
	ch <- c.jitter.mustNewConstMetric(float64(timex.Jitter) / divisor)
	ch <- c.shift.mustNewConstMetric(float64(timex.Shift))
	ch <- c.stabil.mustNewConstMetric(float64(timex.Stabil) / ppm16frac)
	ch <- c.jitcnt.mustNewConstMetric(float64(timex.Jitcnt))
	ch <- c.calcnt.mustNewConstMetric(float64(timex.Calcnt))
	ch <- c.errcnt.mustNewConstMetric(float64(timex.Errcnt))
	ch <- c.stbcnt.mustNewConstMetric(float64(timex.Stbcnt))
	ch <- c.tai.mustNewConstMetric(float64(timex.Tai))

	return nil
}
從 source code 得知是 unix.Adjtimex(timex) 得到的值,沒有 error,而取得的 status 為 5,
https://github.com/golang/sys/blob/master/unix/zsyscall_linux.go#L489
func Adjtimex(buf *Timex) (state int, err error) {
	r0, _, e1 := Syscall(SYS_ADJTIMEX, uintptr(unsafe.Pointer(buf)), 0, 0)
	state = int(r0)
	if e1 != 0 {
		err = errnoErr(e1)
	}
	return
}
syscall 是一個指向底層操作的 interface,而我在 man7.org 上查到 adjtimex 是可以訪問 kernel time 的 program,而如果回傳 5 則是 TIME_ERROR:
...
TIME_ERROR
    The system clock is not synchronized to a reliable server.
    This value is returned when any of the following holds
    true:

    •  Either STA_UNSYNC or STA_CLOCKERR is set.

    •  STA_PPSSIGNAL is clear and either STA_PPSFREQ or
        STA_PPSTIME is set.

    •  STA_PPSTIME and STA_PPSJITTER are both set.

    •  STA_PPSFREQ is set and either STA_PPSWANDER or
        STA_PPSJITTER is set.

    The symbolic name TIME_BAD is a synonym for TIME_ERROR,
    provided for backward compatibility.
在lkml.iu.edu 文章中對於 maxerror 有更好的解釋:
long maxerror (ro)
This member is the value of the time_maxerror kernel variable,
which represents the maximum error of the indicated time relative
to the primary synchronization source, in microseconds. For NTP,
the value is initialized by a ntp_adjtime() call to the
synchronization distance, which is equal to the root dispersion
plus one-half the root delay. It is increased by a small amount
(time_tolerance) each second to reflect the maximum clock frequency
error. This variable is provided bu a ntp-adjtime() system call and
modified by the kernel, but is otherwise not used by the kernel.
種種跡象都顯示這是一個 NTP 時間與 kernel time 的不同,但弔詭的地方是我透過 hwclock 與 date 進行比較,並未看出差異:
hwclock --show&&date +"%Y-%m-%d %H:%M:%S.%N%:z"
可能的原因
其實如果直接 Google 搜尋 NodeClockNotSynchronising 錯誤,在第一個網頁就可以看到 Redhat 官方 Issue。
透過 chronyc 指令可以查詢 chronyd 的每個來源的訊息:
chronyc sourcestats -v
可以看到客戶設定的 2 個 NTP server 中,其中一個偏差值特別高:
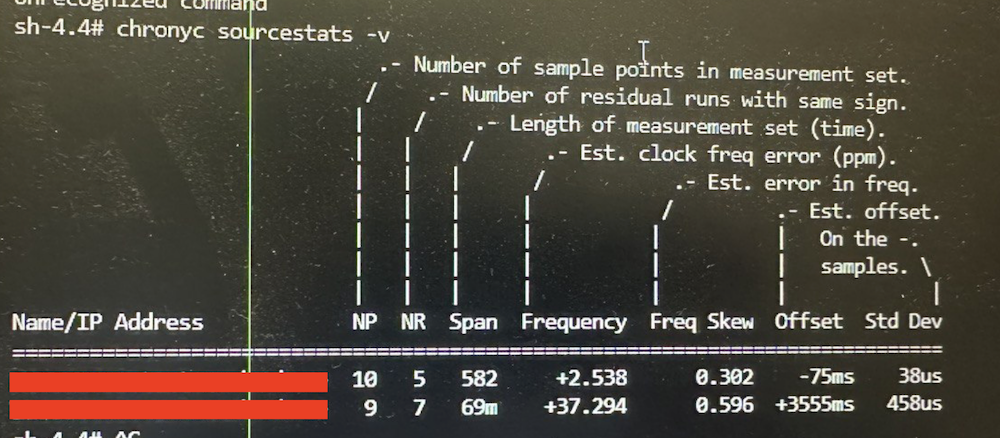
根據客戶的反饋,在事發之前確實有對NTP做過調整。此外,Redhat 在另外一篇 Issue 中有提到,不建議設定 2 個 NTP Server,原因與系統設定 NTP Server 的機制有關,可以參考這篇: https://support.ntp.org/Support/SelectingOffsiteNTPServers
如果設定 2 個 NTP Server,當其中有一台 NTP 異常時,系統無法判斷哪一個更好,因為你沒有任何其他參考來比較它們。根據 Best practices for NTP,至少選擇 4 台為佳。
Upstream Time Server Quantity
Many people wonder how many upstream time servers they should list in their NTP configuration file. The mathematics are complex, and fully understood by very few people. However, we can boil them down to some simple rules-of-thumb:
If you list just one, there can be no question which will be considered to be "right" or "wrong". But if that one goes down, you are toast.
With two, it is impossible to tell which one is better, because you don't have any other references to compare them with.
This is actually the worst possible configuration -- you'd be better off using just one upstream time server and letting the clocks run free if that upstream were to die or become unreachable.
With three servers, you have the minimum number of time sources needed to allow ntpd to dectect if one time source is a "falseticker". However ntpd will then be in the position of choosing from the two remaining sources.This configuration provides no redundancy.
With at least four upstream servers, one (or more) can be a "falseticker", or just unreachable, and ntpd will have a sufficient number of sources to choose from.
結論
再報告給客戶之後,後來 Metrics 就正常了,也沒有聽到其他問題。但對於此次事件還有一些疑點:
-
node_timex_maxerror_seconds{job="node-exporter"}為什麼都是 16 -
Adjtimex 是依據什麼判斷
TIME_ERROR
未來如果有時間,會希望補上這方面的知識,如果讀者您知道答案,還麻煩您私訊給我,幫我解惑,謝謝。