Missing HAProxy Metrics
OCP 的 router 無法監控,因為 haproxy 的 metrics 消失了
這篇文章將分析在 Openshift 環境中遇到的一個 HAProxy 相關 Bug。我們將討論 Bug 的成因、影響範圍以及解決方案。
問題描述
客戶回報 Grafana 上客製的: OCP 流量監控的 Dashboard 突然沒有資料,但經過檢測,OCP 上的元件及 Grafana 都是正常的。
調查經過
客戶版本為 OCP 4.12,經過測試,工作流程為:
- Grafana 作為 UI 介面
- 訪問 OCP 上的 Thanos Query
- Thanos Query 將 Prometheus 上的 metrics data 彙整,並傳回 client
- 取得資料,呈現於 Grafana Dashboard 上
可以透過 OCP 提供的 metrics 查詢工具,查看 metrics 資料是否存在,路徑為:
OCP console > Observe > Metrics
經過調查,我們發現 Prometheus 是突然抓取不到 metrics,抓取不到的原因則是 HAProxy 並未 export metrics
調查結果
觀測到,HAProxy 的 metrics 消失時,其 endpoints 剛好超過 500,推斷為造成這次事件的原因。而這裡指的 endpoint,是指 Openshift Ingress Controller 將 Route 轉換為 haproxy 的 endpoint,並非 Kubernetes 的 Endpoint,可以透過以下2種方法取得當前的 endpoints 數量:
- 查看 haproxy.conf
在 router pod 上執行以下指令:
cat haproxy.config | grep " server" | grep fe | wc -l # simple, might not accurate
- 查詢以下 metrics
Query haproxy_server_up metrics
透過分析 Openshift 在 GitHub 上的 source codes,當 endpoints 數量超過 threshold 時,HAProxy 可能為了不影響效能,將停止 export metrics,這也是客戶的 Dashboard 所觀測到的現象:
https://github.com/openshift/router/blob/master/pkg/router/metrics/haproxy/haproxy.go#L458
// If we exceed the server threshold, ignore the rest of the servers because we will be
// displaying only backends and frontends.
if row[32] == serverType {
    servers++
    if servers > e.opts.ServerThreshold {
        continue
    }
}
在 router pod 上呼叫 haproxy 的 API,可以獲得當前的 threshold:
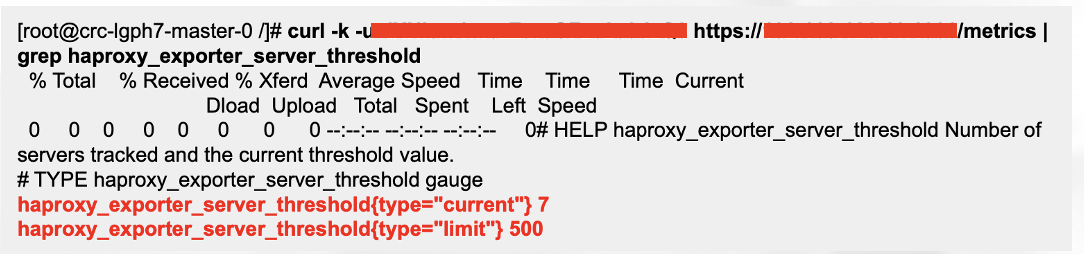
這件事情也被記錄在 RedHat 的 Known issues: https://bugzilla.redhat.com/show_bug.cgi?id=2024965。
解決方法
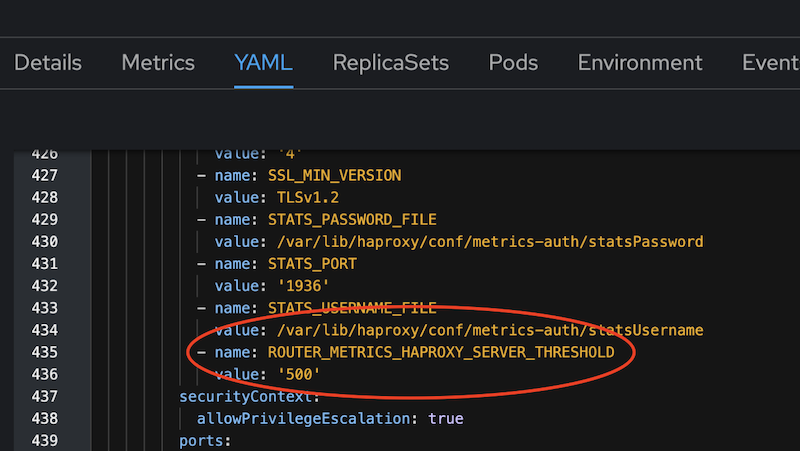
OCP 上的 HAProxy 由 Openshift Ingress Controller 所控制,在 4.12 版本並沒有 field 可以修改 Threshold,根據 RedHat Support 的回覆,在 OCP 4.14 有 RFE 追蹤: https://issues.redhat.com/browse/RFE-2195
一個臨時的解決方法是,在 Openshift Ingress Controller 的設定上,可以加入 env ROUTER_METRICS_HAPROXY_SERVER_THRESHOLD,修改 threshold 的值 oc edit IngressController: